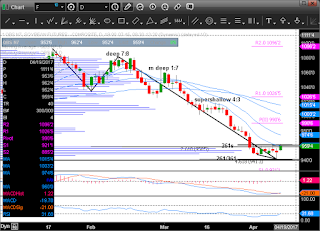
Pattern Analysis: Soybeans have been trading lower
since its Jan 18th high of 1092.50 on the July contract. This recent downtrend has a dominant MM with
deep retracement and 7:8 left-handed skewing.
The 1st level supporting MM has medium deep retracement with 1:7
left-handed skewing. Together they
create my Fade Zone (962.375 to 864.625).
Because both retracements are larger than 50%, I consider this a weak downtrend that should
produce a nice upside move if a low is established within it. In addition, both have left-handed skewing
which signals a lack of downside momentum.
Finally, there's a 2nd level supporting MM with supershallow retracement
and 4:3 right-handed skewing. This last
piece provides a Fib extension of its own from 974.875 to 941.375. It's this last MM that could help narrow down
my overall Fade Zone. Overlapping the
two gives me the 1st area (960.50 to 941.00) that I will focus on for a
possible bullish trade.
Pattern Update: Yesterday's low was 941.25, which
was at the very bottom of the 1st area I was monitoring for a possible bullish
trade, just above the low from 8/2/16, and right at my 261/361 Fib combo. Prices ended up closing up towards its open
creating a long lower shadow. These
bullish supporting signals. In addition,
we have a possible double bottom forming.
We need a close above 960.25 to confirm it. Stops would be placed ~ 948.00. Target 1 is @ 973.50 with target 2 @
978.00. Supporting the double bottom, we
have bullish divergence on the RSI and a bullish crossover on the MACD. In addition to trading the double bottom
pattern, you could go long at the 261 Fib combo turn bar @ 960.50. Stops would be placed below the recent low @
941.00. Minimum upside objective would
be @ 1016.75.
Upside obstacles include the 10, 20, 50,
and 100 DMA's; the monthly pivot; and a volume @ price resistance zone.
Wednesday, April 12, 2017
Subscribe to:
Post Comments (Atom)
Blog Archive
-
▼
2017
(104)
-
▼
April
(23)
- T-Bond
- Gold
- Nasdaq (last update)
- Nasdaq (update)
- Cocoa (last update)
- Soybeans
- Cocoa (update)
- Gold (update)
- Gold (update)
- Heating Oil (update)
- Gold (update)
- Nasdaq (update)
- Cocoa (update)
- Gold (update)
- Nasdaq (update)
- Heating Oil (update)
- Gold (update)
- Nasdaq (update)
- Gold
- Heating Oil (update)
- Copper (update)
- Nasdaq (update)
- Cocoa (update)
-
▼
April
(23)


No comments:
Post a Comment