Sunday, June 27, 2010

Nasdaq Composite

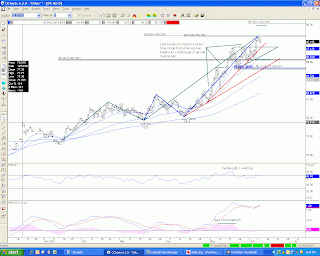
We have a possible weekly H&S Top pattern forming on the Nasdaq cash index.  A weekly close below ~2139 will confirm it.  The LS formed with left handed skewing (3 bars down: 5 bars up), which showed some weakening upside momentum.  The HEAD formed around the weekly 261/261 fib extension combo combined with a 78.60 retracement level and overbought RSI.  The potential RS is forming around a 50% retracement level, which is neutral.  If we can get confirmation this week, then we will have right handed skewing (2 bars up: 1 bar down).  This will show increasing downside momentum with a H&S target of ~1735.  Plenty of obstacles lie in its path, however.  First, you have the 50 and 100 DMA's.  Then you have the 38.20, 50.00, and 61.80 retracement levels.  Finally, you have numberous fib extensions. 

In summary, we are still in an uptrend.   However, if the pivot low of 2100.17 is taken out we will no longer have higher weekly highs and higher weekly lows.  This will signal a trend change and a correction will take place.  The new question will be how low do we go.  The weeks to come will give us better clues, but the H&S top target is one early potential zone.


Thursday, June 10, 2010

Dollar (Update)

The dollar has continued to sell-off from the resistance zone from a few days ago.  Today it closed below a significant uptrend line (9 points).  If we take out the previous pivot low of 85.325 you will no longer have higher highs and higher lows in place.  This would signal a trend change.  I expect the 78.60 retracement level to be tested and provide some support around 86.10. 

Euro (Update)

Today we formed a High Close Doji pattern as we closed at 1.2096 (above the doji high of 1.201) got a bullish MACD crossover.  However, we still are waiting on a stochastics breakout (may come tomorrow) and closed under the 10 DMA (suggested yesterday as a possible resistance area).  I think we can move higher from here, but I still would look to sell rallies in this market.

Below is a snapshot of the Euro on an intraday chart (60M):


This rally has taken the route of 5 significant measured moves.  The first 3 all have deep retracements (~78.60%), which is indicative of a weak trend.  This usually sets up a good countertrend trade, which in this case would be in the direction of the longer trend- down.  Depending on what happens overnight some possible resistance zones are: 1.2190-1.2200, 1.2225-1.2255, 1.2280-1.2300, 1.2315-1.2330.  The 1.2225-1.2255 area may present a good place to get short.  I don't expect 1.2330 to be taken out without a significant correction.

Wednesday, June 9, 2010

Euro (Update)

We failed to get upside confirmation today.  The market rallied overnight and most of the day only to sell off pretty hard in the final hour.  We are looking for a close above 1.201 to initiate a High Close Doji pattern.  While today's close fell short, tomorrow is another day.  The 10 DMA is lurking overhead around 1.2095, which will present the first line of resistance.

Tuesday, June 8, 2010

Euro

Is it finally time for a rally in the Euro? Today we got a star doji candle pattern on the daily chart.  This pattern formed just slightly above the DS1, MS1, and WS1 pivot points.  There is also a 461/461 fib extension average @ 1.1877 (low two days ago @ 1.1874) combined with RSI price divergence, RSI oversold, and MACD loss of momentum.  If we can get some upside confirmation overnight and tomorrow, then we could see a decent rally.


Gold (Update)

On May 22nd, I wrote that we were in a potential cluster of support and would be confirmed if we got some follow through buying.  Well, we have rallied nicely from that cluster around 1168.00 up to a high of 1252.10 today.  I'm attaching an updated snapshot of the June contract (front month now August) for comparison purposes.  August Gold looks poised to test 1275-1285 area.


Dollar (Update)

Back on May 22nd I gave a couple possible support zones.  The first zone (85.25-85.40) held and we have been moving higher since.  We had an ascending triangle breakout on June 4th, but the market ran into some fib resistance in the 88.7508-88.8275 area (actual high was 88.80).  You have some conflicting signals at these levels:
Bullish:  still maintaining two upward trendlines (shown in red); still above all moving averages (10,20,50,100); still making higher highs, higher lows.
Bearish:  hit some stiff fib resistance ~ 88.80 (461/361 extensions); RSI price divergence signals warning; MACD showing loss of upside momentum; ran into pivot resistance yesterday (DR1,MR1,WR1).