
Sunday, April 30, 2017
T-Bond
A possible bullish
MM Pullback trade is developing in the T-Bond.
First, this pattern relates to a MM breakout pattern seen on a daily
chart. This MM has a supershallow
retracement, which is bullish, with 4:1 right-handed skewing. Any pullback within the 38/78 retracement
area is considered a potential buying opportunity. My MM Pullback Zone is from 152.25 to
151.3125. Supporting this potential
pullback trade is that prices are above the monthly pivot and the 50 and 100
DMA's. We also have a previous swing
high trend line serving as support.
Finally, there's a possible double bottom seen on a 240M chart. We'd need a close above 153.0625 for pattern
confirmation.

Gold
A possible bullish
Fib Cluster Pullback trade is developing in Gold. The Fib cluster zone is currently between
1264.20 and 1253.20. It contains a
combination of 3 Fib retracements or extensions from a dominant MM with neutral
retracement and a supporting1 MM with supershallow retracement shown on a daily
chart. Further supporting this zone is a
previous 4 point downward sloping resistance line that is now serving as
support, a 6 point upward sloping trend line, and a previous swing high trend
line. Prices are still also above both
the 50 and 100 DMA's. A move above
1272.80 triggers a long entry with stops
below 1253.20. Target1 @ 1294.40,
target2 @ 1300.90, and target3 @
1307.70.


Tuesday, April 25, 2017
Wednesday, April 19, 2017
Nasdaq (update)
The following market recap is from my newsletter for the week ending 4/13: "This past week saw
prices come off further after establishing a bearish engulfing pattern on
4/5. The market closed below its 20 DMA
on Tuesday and it has served as upside resistance the past 2 days. We haven't closed below the 20 DMA for more
than one day since December, so this is something to watch. We did find support at the MS1 @ 5351.42. That level along with the 50 DMA are the next
downside obstacles to overcome." This week has continued to see resistance @ the 10 and 20 DMA's and could be forming a head and shoulders top pattern. The head of the pattern was formed with a bearish engulfing pattern that lead to a short entry @ 5408.75 with stops @ 5481.50. The pattern itself is forming in the top of my MM Fade Zone, which is calling for a reversal. If prices break through the pattern neckline tomorrow, then we would need a close below 5354.25 for confirmation. Stops would be placed @ 5431.00. Target 1 would be @ 5245.00 and target 2 would be @ 5208.50. In addition, another short entry could be placed at my 361/461 Fib combo @ 5344.50 with stops @ 5481.50. The downside target on this entry would tentatively be @ 5065.50.


Cocoa (last update)
The bullish Cocoa set-up from my original 2/2 post is now considered void and failed to reach its minimum upside target. CLICK HERE for the original post.
I'm now focused on another potential bullish MM Fade pattern, but on a much smaller scale than the last one.
Here's the Pattern Analysis: Cocoa might be setting up for a smaller MM Fade pattern with the focus on the move down from the March 21st high of 2188 on the July contract. This recent downtrend has a dominant MM with deep retracement and 1:3 left-handed skewing. The supporting1 MM has neutral deep retracement with 4:2 right-handed skewing. Together they create my Fade Zone (2023 to 1815). Because both retracements are larger than 50%, I consider this a weak downtrend that should produce a nice upside move if a low is established within it. You can expect a bounce to a minimum of the 50% retracement level from that March 21st high and the potential low.
Here's the Pattern Analysis: Cocoa might be setting up for a smaller MM Fade pattern with the focus on the move down from the March 21st high of 2188 on the July contract. This recent downtrend has a dominant MM with deep retracement and 1:3 left-handed skewing. The supporting1 MM has neutral deep retracement with 4:2 right-handed skewing. Together they create my Fade Zone (2023 to 1815). Because both retracements are larger than 50%, I consider this a weak downtrend that should produce a nice upside move if a low is established within it. You can expect a bounce to a minimum of the 50% retracement level from that March 21st high and the potential low.
Wednesday, April 12, 2017
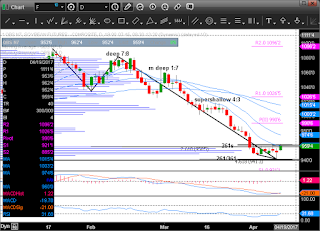
Soybeans
Pattern Analysis: Soybeans have been trading lower
since its Jan 18th high of 1092.50 on the July contract. This recent downtrend has a dominant MM with
deep retracement and 7:8 left-handed skewing.
The 1st level supporting MM has medium deep retracement with 1:7
left-handed skewing. Together they
create my Fade Zone (962.375 to 864.625).
Because both retracements are larger than 50%, I consider this a weak downtrend that should
produce a nice upside move if a low is established within it. In addition, both have left-handed skewing
which signals a lack of downside momentum.
Finally, there's a 2nd level supporting MM with supershallow retracement
and 4:3 right-handed skewing. This last
piece provides a Fib extension of its own from 974.875 to 941.375. It's this last MM that could help narrow down
my overall Fade Zone. Overlapping the
two gives me the 1st area (960.50 to 941.00) that I will focus on for a
possible bullish trade.
Pattern Update: Yesterday's low was 941.25, which was at the very bottom of the 1st area I was monitoring for a possible bullish trade, just above the low from 8/2/16, and right at my 261/361 Fib combo. Prices ended up closing up towards its open creating a long lower shadow. These bullish supporting signals. In addition, we have a possible double bottom forming. We need a close above 960.25 to confirm it. Stops would be placed ~ 948.00. Target 1 is @ 973.50 with target 2 @ 978.00. Supporting the double bottom, we have bullish divergence on the RSI and a bullish crossover on the MACD. In addition to trading the double bottom pattern, you could go long at the 261 Fib combo turn bar @ 960.50. Stops would be placed below the recent low @ 941.00. Minimum upside objective would be @ 1016.75. Upside obstacles include the 10, 20, 50, and 100 DMA's; the monthly pivot; and a volume @ price resistance zone.

Pattern Update: Yesterday's low was 941.25, which was at the very bottom of the 1st area I was monitoring for a possible bullish trade, just above the low from 8/2/16, and right at my 261/361 Fib combo. Prices ended up closing up towards its open creating a long lower shadow. These bullish supporting signals. In addition, we have a possible double bottom forming. We need a close above 960.25 to confirm it. Stops would be placed ~ 948.00. Target 1 is @ 973.50 with target 2 @ 978.00. Supporting the double bottom, we have bullish divergence on the RSI and a bullish crossover on the MACD. In addition to trading the double bottom pattern, you could go long at the 261 Fib combo turn bar @ 960.50. Stops would be placed below the recent low @ 941.00. Minimum upside objective would be @ 1016.75. Upside obstacles include the 10, 20, 50, and 100 DMA's; the monthly pivot; and a volume @ price resistance zone.


Tuesday, April 11, 2017
Cocoa (update)
Over the weekend, I posted "One area I will be looking closely at is between 1946 and 1918. In it, there's a 261/361 Fib combo, a 78% retracement level, MS1 @ 1913, and the 361 Fib combo @ 1918. If this zone doesn't hold, then I feel we will retest the recent lows. So, for now I'd stay in the long position entered @ 1947.50 and look for another possible entry lower." Today's low was 1934, which fell right in the middle of my potential support zone. Buyers came in and pushed prices near the highs creating a piercing line candlestick, which could help trigger higher prices. The recent sell off caused damage to the bullish case, but there's an opportunity for a low risk/high reward trade. You could go long @ 1982, which is the 261 FIb combo. Stops would be below the piercing line candle @ 1933 with a minimum target of 2080. The target is right around a volume @ price resistance zone and just above the falling window.


Gold (update)
Gold triggered a MM Pullback buy entry today with a strong breakout. It closed above a 4 point downward sloping trend line and was the highest close since November. Its high was just shy of the monthly R1 pivot and looks to be headed toward my target range of 1293.30 to 1313.20. Entry price was @ 1259.00 with conservative stop @ 1241.40 and aggressive stop @ 1248.10.


Monday, April 10, 2017
Gold (update)
We did find
support today between 1250.60 and 1246.80 setting up a potential MM Pullback
pattern. First, this
pattern relates to a MM breakout pattern seen on a daily chart. This MM has a supershallow retracement, which
is bullish, with 4:5 left-handed skewing.
Any pullback within the 38/78 retracement area is considered a potential
buying opportunity. My MM Pullback Zone
is from 1250.6 to 1246.80. Supporting
this pattern is a 3 point upward sloping trend line and prices being above the
50 DMA, the 100 DMA, and the monthly pivot.
Entry will just above today's high @ 1259.00. Conservative stop would be @ 1241.40 with aggressive
stop @ 1248.10. Target range would be
1293.30 to 1313.20.


Saturday, April 8, 2017
Heating Oil (update)
This past week saw
heating oil reach its MM Fade pattern minimum objective and its double bottom
objectives. Next up is the MM Pullback
minimum target of 1.7122. Prices are currently
above all 4 moving averages, but found resistance at a 461 Fib extension from a
small MM pattern. There's also upside
resistance from a volume @ price range between 1.6415 and 1.6720. In this range, there's a monthly R1 pivot
that could cause a pullback. Over all,
this pattern is still looking very good with lower support between 1.6000 and
1.5685.


Gold (update)
It was a pretty
interesting week for Gold. After
confirming a flag pattern last week, we had the makings of a potential upside
breakout of 2 MM patterns. There was
also a potential sym triangle pattern forming.
Friday saw the 2 MM patterns activated, but we failed to confirm the sym
triangle pattern. Prices broke higher to
only fall back and close inside the triangle.
This pattern is now void. The
flag and MM patterns are still active, however.
Gold is now facing a 4 point downward sloping trend line. That needs to be taken out to gain any upside
potential. To the downside, there's
possible support between 1250.60 and 1246.80.
That could be an area for a very low risk, high reward entry. If prices trade below 1241.50, then the flag
pattern fails along with one of the MM patterns.


Nasdaq (update)
Another bearish
trade could've been entered on Thursday below the engulfing pattern from
Wednesday. Entry @ 5408.75 with stops @
5481.50. Downside target still ~
5150.00. We ended the week remaining
above all 4 moving averages with the 20 DMA serving as continued support. That needs to be breached for the bearish
case to take hold.


Cocoa (update)
Friday's price
action did some chart damage to my bullish call. Prices gapped lower creating a falling window
pattern. We are also back below all four
moving averages and below the double bottom neckline. However, we do have a bullish MM Fade pattern
about to become active once 1983 is reached.
The dominant MM has deep retracement with 1:3 left-handed skewing. The supporting1 MM has neutral deep
retracement with 4:2 right-handed skewing.
Together they create a bullish Fade Zone between 1983 and 1854. One area I will be looking closely at is
between 1946 and 1918. In it, there's a
261/361 Fib combo, a 78% retracement level, MS1 @ 1913, and the 361 Fib combo @
1918. If this zone doesn't hold, then I
feel we will retest the recent lows. So,
for now I'd stay in the long position entered @ 1947.50 and look for another
possible entry lower.


Wednesday, April 5, 2017
Gold (update)
Gold is forming a possible symmetrical triangle pattern. If we get a close above 1263, then it will be confirmed. This, combined with the active flag pattern, a possible supershallow MM pattern, and a possible neutral MM pattern makes for a very interesting market to watch. A move above 1268.10 could really trigger a big move to the upside. Next area of resistance would be the monthly R1 @ 1277.60


Nasdaq (update)
We made new highs today on selling and closed below the 10 DMA. We also formed a bearish candle pattern engulfing the previous 4 days. So, over the past 5 trading days, we've had this engulfing pattern along with 3 doji's. I believe the market is signalling a tired market that needs a correction. So, in addition to the short position I suggested the other day that has stops at 5535.25, I'd get short @ 5403.00. I'd put stops above the high of 5481.50. This is potentially a low risk, high reward trade because these candle patterns are inside my Fade Zone. If a top is established inside it, then you can expect a large downside move. My first estimated target is ~ 5166.00. I'd like to see follow through selling tomorrow and close below the 20 DMA. We haven't closed below it for more than one day since December. It would set-up an immediate test of the 50 DMA ~ 5317.00.


Tuesday, April 4, 2017
Heating Oil (update)
Heating Oil has had a nice little run-up over the past few days since confirming the double bottom pattern. Today it met my minimum double bottom target @ 1.5879. Next up is the full double bottom target @ 1.6029, which sits right below a 50 DMA and a 361 Fib extension. This area could provide some resistance and see prices come off a bit.


Gold (update)
Gold confirmed a flag pattern yesterday and saw early follow-through buying today. But, prices found resistance near a 261 Fib extension from a MM breakout pattern on the 240M chart that coincided with a downward sloping trend line. The next key price levels remain 1264.20 and 1268.10. If we can close above them it should trigger a nice upside breakout. First, it would void the 3 point trend line serving as resistance. Second, it would trigger a supershallow MM breakout pattern. Finally, it would trigger a neutral MM breakout pattern. Gold is definitely worth watching this week.


Nasdaq (update)
Prices traded
below yesterday's doji triggering a short trade. But, it found support at the monthly pivot
and closed back near its opening price.
We now have 3 consecutive doji's, which could be signalling a tired
market. It's worth taking a small
bearish position with stops above 5533.50.
That's where my MM Fade pattern fails.


Saturday, April 1, 2017
Gold
Gold is setting up for a possible flag pattern with a move above 1252.80. Stops would be placed below 1241.50 with the pattern objective ~ 1307.70. If we get a move above 1264.20, then it would create a MM breakout pattern that has supershallow retracement. And if we get a move above 1268.10, we'd get another MM breakout pattern that has neutral retracement. Both MM patterns would be bullish and together create a catalyst to reach the upside pattern targets of 1307.70 to 1336.30. Prices are currently above the 10, 20, 50, and 100 DMA's so the chart is set up nicely. Let's see how next week plays out as we would want an immediate upside breakout.


Heating Oil (update)
Friday saw more
bullish action with a 4th consecutive day with closing prices above the
previous day's high. We are over half
way to the double bottom objective, which coincides with a 361 Fib extension
from a small MM pattern. There's also a
50 DMA in that area, so look for possible resistance ~ 1.6006.


Copper (update)
The Fib Pullback trade was voided on Thursday as prices traded above 270.00 The head & shoulders top pattern is still intact.


Nasdaq (update)
We formed back to
back doji's near last week's highs. If
you didn't exit the short position at the scratch price, then I'd hold on with
the original stops @ 5533.25. If you did
exit, then I'd consider re-entering below today's doji low of 5421.00. This would be another sell trigger as prices
are still trading within my MM Fade Zone.
If prices move above 5533.00, then this pattern is void. Doji's can either be the market taking a
breather OR signs of a reversal. The
placement of these doji's, in my sell zone and near recent highs, makes it more
concerning to long positions. I'd be
cautious of holding any if we break
lower. It could be the making of a
double top pattern. Let's see how next
week shakes out.


Cocoa (update)
Thursday, the
objective of the symmetrical triangle was met @ 2066. Friday was pretty quiet action with prices
holding above MR1. If we can hold above
2028 and make new highs above 2187, then we will have a MM breakout pattern
with neutral retracement. That would be
bullish and help prices continue higher.
The long position is still in great shape.


Subscribe to:
Posts (Atom)

