Thursday, April 28, 2011
Cotton
July Cotton reached its H&S Top objective today ~ 149.03. It reached this area pretty quickly: over 39 points in just 12 trading days. The reward to risk ratio was a solid one: 2.63 to 1.00. It takes deep pockets to trade this market, but if you have the capital it would've meant risking ~ 7475 to make ~ 19660 on a one lot. Not bad for less than 3 weeks work. Yesterday I stated there is some potential support in this 130-150 area. We touched the top end of this range today. Let's see if we get a bounce from somewhere in this area in the next few days. You saw the first real signs of buying in 3 weeks with the lower shadow on today's candle. I expect some lower prices before we get a significant bounce.
Wednesday, April 27, 2011
Cotton (update)
It's time to revisit the July Cotton H&S pattern that was confirmed back on 4/12. This market has sold off very hard since then and closed limit down today at 153.39. The objective for this pattern is 149.03, which is in the crosshairs. There is a possible support zone in the 129.70-150.35 area. I expect this market to test this area and get an oversold bounce. Fib support calls for a test to 140.00 or so with strong support around the 131.75 area. Let's see if we meet our objective and if a bounce occurs in this area.
Thursday, April 14, 2011
Crude (July)
Crude has rolled over, but wanted to update the July action one last time. The market did sell off in the resistance zone and found support at the second of three support levels. I expect a run to test the recent highs.
Cocoa (July)
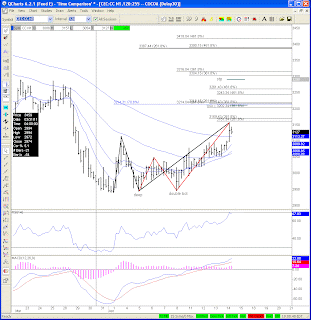
There is a possible sell set-up taking place in July Cocoa. The 3200-3225 area is showing a confluence of fib resistance. A butterfly pattern has formed on the 120M chart and the move up off the recent lows has been weak. You have some deep retracements and left handed skewing, which are both signalling a possible stall at higher prices. There is also a grouping of pivot resistance between 3183 and 3221 (DR2, WR2, MP). I'm looking to short around 3210 with a stop at 3290 with an initial target of 2940.
Wednesday, April 13, 2011
Cotton
Cotton has moved into July from March. So I will now focus on the July chart. Yesterday we got confirmation of a h&s top with a close below the upward sloping neckline. This patterns target is around 149.05 with an initial stop at 203.30.
Monday, April 11, 2011
Crude
Crude hit a high of 113.46 and sold off hard forming a bearish engulfing pattern. There was plenty of resistance ahead- I expected a bit higher move before strong selling. As it turned out it caught some pressure in the early part of the sell zone. There's some possible support zones to watch for: 106.75-107.25 and 105.00-105.50.
Sunday, April 10, 2011
Crude Oil
May Light Crude Oil is starting to head into a resistance zone. There is a cluster of fib resistance tracing to some pivot points as far back as Aug '10. I would label this zone from 113.15-121.15 with some stiff resistance around the 117.50 area. In front of this level you also have some pivot point resistance lining up with the MR2 @ 115.25 and WR2 @ 116.92. The most recent move up of the 97.02 pivot low has been strong with a shallow retracement and a 3:2 skew breakout. The 261, 361, 461 extensions of this pattern are 113.15, 117.14, and 121.13 respectively. I would expect these recent run-up to stall around one of these extensions as it also coincides with some fib resistance from much older patterns. Let's see if we can stretch a bit higher, stall, and then retest the 108.25 pivot high.
Cotton
Cotton has not been able to close below the upward sloping neckline of the possible h&s top formation. It now is an 8 point trendline. The market bounced off this area hard last Tuesday. However, the market failed to make a new high and saw some sellers come in on late Thursday and Friday. We are seeing some consolidation the past 4 weeks and it will be interesting to see if we make new highs or take out that trendline next week.
Sunday, April 3, 2011
Cotton
Cotton has found support the past 3 days at the rising window from the gap up made back on March 18th. You also have a 5 point upward sloping trendline in the same area, which also happens to be the neckline of the possible H&S top that maybe forming. Friday found some negative trading: new highs on selling. This rising window/neckline area will be a key area this coming week. If we can get a break below 192.23 on Monday you could see a good move lower. This move would be made with a pivot of less than 50%, which is bearish AND with a 2:1 skew, which is also bearish. Initial support would be seen around the 183.00-186.00 area. This zone features horizontal support, the double top tgt, monthly and weekly pivot point support and a 50 DMA. I could see a move to this area and then a possible retest of the neckline. Let's see how this week plays out.
Subscribe to:
Posts (Atom)


