
Thursday, March 30, 2017
CRB Index Long Term Forecast
The CRB Index is an index of 19 commodity futures and weighted most heavily in Energy and Agriculture. Looking over the weekly chart, I see a potentially large upside move developing. The CRB index sold off aggressively from June 2014 to the recent lows in January 2016 without any significant rallies. It put in a double bottom during that time, which help kickstart higher prices. Over the course of the next 12 months it managed to form a measured move (MM) breakout. This MM had a shallow retracement, which is bullish, but had 8:24 left-handed skewing. The leg up off the August 1st low had 2 MM patterns with deep retracements. The left-handed skewing of the main MM pattern along with the 2 MM patterns with deep retracements created weak upward momentum and helps explain why prices were not able to push much higher. So a pullback was to be expected. In these situations, a pullback support zone can present itself between the 38/78 retracement levels indicated on the chart below. Prices traded into this zone (182.7734 to 180.5094) and found some support. Helping the case was the dominant MM pattern on the Jan 2017 leg down. It had a medium deep retracement, which is weak, and created a 361 Fib extension into the pullback zone @ 181.6392. The low was 181.5533. Since trading higher, on March 21st there was a bullish MACD crossover on the daily chart. My long term forecast is for prices to reach 217.7016 BEFORE falling below 176.6698, which is the pattern failure level. A move up to the 217.7016 area is a big move and I would expect it to take 6 to 12 months. Long term patterns in many of the index components also predict higher prices. This will be something to keep an eye on for the next few months to see if the 176.6698 level can indeed hold.

Heating Oil
Heating Oil confirmed a double bottom pattern yesterday on the May contract with a close above 1.5428. Entry price is @ 1.5429 with stops ~ 1.5085. Conservative target is @ 1.5875 (75% of pattern obj) and aggressive target @ 1.6024 (100% of pattern obj). Supporting this double bottom, there is bullish divergence on the RSI and a bullish crossover on the MACD. We also were able to close above the 10 and 20 DMA's. The next upside resistance is @ 1.5579 (MS2) and @ 1.5680 (Fib 261). Underlying support should be found at the volume @ price area between 1.5149 and 1.5075.
This pattern, by itself, shapes up nicely. But, what makes it even more interesting is the bigger pattern that could be developing with it. This double bottom pattern formed right in a MM Pullback Zone between 1.5187 and 1.5007. This pullback area relates back to a dominant MM pattern shown on the weekly chart with a neutral retracement. Anything less than 50% indicates a healthy uptrend. The projected MM target is 1.8875. So, we have an opportunity for a low risk, high reward set-up going with the recent uptrend shown on the weekly chart. In addition to trading the double bottom pattern, you could also go long @ 1.5429 with stops @ 1.4824. Conservative target would be @ 1.7122 with an aggressive target @ 1.777. Both have reward:risk ratios above 2.50. Finally, a much larger long term trade could be made with entry @ 1.5429. Stops would be placed @ 1.3616 with the target @ 1.8875 for a nice 2.90 reward:risk ratio. Although this last trade is probably too large for the average trader, it's worth keeping an eye on longer term.


This pattern, by itself, shapes up nicely. But, what makes it even more interesting is the bigger pattern that could be developing with it. This double bottom pattern formed right in a MM Pullback Zone between 1.5187 and 1.5007. This pullback area relates back to a dominant MM pattern shown on the weekly chart with a neutral retracement. Anything less than 50% indicates a healthy uptrend. The projected MM target is 1.8875. So, we have an opportunity for a low risk, high reward set-up going with the recent uptrend shown on the weekly chart. In addition to trading the double bottom pattern, you could also go long @ 1.5429 with stops @ 1.4824. Conservative target would be @ 1.7122 with an aggressive target @ 1.777. Both have reward:risk ratios above 2.50. Finally, a much larger long term trade could be made with entry @ 1.5429. Stops would be placed @ 1.3616 with the target @ 1.8875 for a nice 2.90 reward:risk ratio. Although this last trade is probably too large for the average trader, it's worth keeping an eye on longer term.


Tuesday, March 28, 2017
Copper (update)
Copper came within
0.80 of my minimum downside target yesterday before roaring back. It closed near its highs creating a tall
lower shadow. This was the first
warning sign that my bearish trade could be in trouble. At that point, stops could have been moved
down to break even. Today, we saw prices
close above a 5 point downward sloping trend line and right back inside the Fib
Fade Zone. A move above 2.70 voids this
pattern and I'd probably exit now it not done at break even.


Facebook (update)
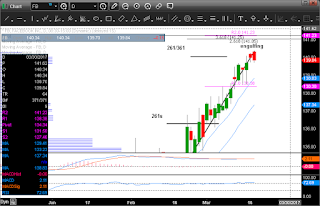
Facebook has come roaring back since its huge engulfing pattern. It is just shy of that 3/21 high and I would exit any bearish positions to wait for another sell signal to materialize.


Nasdaq (update)
The Nasd 100 has
almost recouped it's entire downside move from 3/21. The short position below the doji @ 5402.00
is now taking heat with aggressive stops @ 5535.50. We are now back above all four moving
averages. At this point it's probably
best to take a small loss and wait for another sell signal to materialize.


Cocoa (update)
Cocoa broke out of
a symmetrical triangle pattern to the downside today. It's not surprising considering we had 3
small body candles 3 of the 4 previous days.
The market ran out of steam just below my 2197 to 2237 resistance zone
shown below. The downside target on the
triangle pattern is ~ 2065. That would
still be above a 50% retracement from the recent low, so the uptrend is still
intact. There's a volume @ price support
zone between 1995 and 2025. I would like
this level to hold, otherwise the recent rally could be in jeopardy.


Tuesday, March 21, 2017
Copper (update)
Copper saw follow-through selling today after reaching my resistance zone yesterday. We are now trading below the 10, 20, and 50 DMA along with the monthly S1. Next downside obstacle is the 100 DMA ~ 2.5717. My 1st target is the recent low @ 2.5585.


Facebook (update)
We had a bearish engulfing candle form today at its monthly R2 pivot. This pattern engulfed the previous 7 days and creates major upside resistance. This could become a benchmark candle to the downside. I've been looking for a top in Facebook for the past couple weeks as its been trading inside my Fib resistance zone. We had a false engulfing pattern the other day, but this one seems solid. It also coincides with a potential top I'm seeing in the Nasdaq 100 (see posting on this blog). I see downside targets of 131.50 to 127.50.


Orange Juice (update)
Today we traded through my target window of 187.50 to 191.70 with a huge 3.8% rally. That measured move pattern with shallow retracement and 4:1 right-handed skewing was definitely the trigger. The next upside target is the 361 Fib level @ 200.24.


Nasdaq (update)
We made new highs today on strong selling, best shown by the large red body candle. We also closed below the low of the doji pattern from a couple days ago thus creating a low close doji pattern. If you went short below the doji with my aggressive stop @ 5440.25, then you'd be stopped out. If you went short with my conservative stop @ 5535.50, then you'd still be short. If today's high holds up as a top, then I see aggressive downside targets ~ 5045.50 and conservative targets ~ 5183.50, But, I will revisit as the market develops.


Cocoa (update)
Cocoa had a strong gap up open above the falling window. Prices later closed that lower gap and finished the day right near the open creating a doji candle. This shows buyer and seller equilibrium. I'm not surprised as we are just under my 2 double bottom targets (blue box on chart below) and its 100 DMA. We haven't closed above it since last August, so this is our next big hurdle to overtake. We also have a 361/261 Fib combo along with the monthly R2 between 2197 and 2237. So, I expect this area could provide some short term resistance.


Monday, March 20, 2017
Cocoa (update)
Today prices closed above 2060 confirming a double bottom pattern. We also closed above the 50 DMA for the first time since August 26th. Next upside obstacles are a 261 Fib @ 2124, a falling window @ 2134, a Fib cluster @ 2197 to 2218, the 100 DMA @ 2210, and a monthly R2 @ 2237.


Nasdaq (update)
Entry on the doji pattern was triggered today as prices traded below 5402.25. However, prices found support near its 10 DMA and closed higher. The aggressive stop is @ 5440.25 and the conservative stop is @ 5536.00. We haven't closed below the 10 DMA since December 30th, so that's the 1st downside obstacle we must overcome.


Copper
First off, the May Copper contract has a confirmed head & shoulders top pattern. It broke and closed below the neckline on March 6th. The overall downside target is ~ 2.4730 and my conservative target is ~ 2.5215. Original stops would probably be best above the right shoulder's high of 2.7685. That being said, this market has been rallying since the March 9th low to test the upward sloping neckline. This brings me to my current analysis, which sees Copper running into my Fib cluster resistance zone between 2.6745 and 2.6972. This resistance zone is supported by both the upward sloping h&s neckline and a downward sloping trend line. Today's price action saw higher prices made on selling, as we see a good sized red candlestick, and we closed below the 10 and 20 DMA's. If we can get a close below the 50 DMA soon, then I think Copper will at the very least test the recent lows. That would be the minimum target. Some more aggressive targets would be the 1st h&s top objective @ 2.5215, the monthly S2 pivot @ 2.5152, and the 2nd h&s top objective @ 2.4730. Downside obstacles are currently the 50 DMA ~ 2.6487, the monthly S1 pivot @ 2.6143, the 100 DMA ~ 2.5702, a Fib cluster support zone between 2.5468 and 2.5370, and the monthly S2 pivot @ 2.5152. If prices move back above 2.70, then this Fib cluster retracement pattern is voided.


Sunday, March 19, 2017
Facebook (update)
A bearish engulfing pattern formed on Friday @ my 261/361 Fib combo level. If long, I'd consider taking some profits with a move below 139.70. I'd also consider make a bearish play with options as there's solid upside resistance up to 144.00. Downside target would be 131.50 to 133.50.

Nasdaq (update)
Friday produced an inside bar, so the doji candle was neither triggered nor violated. We have solid upside resistance all the way up to 5535.50. I would initiate a small bearish position with a move below 5402.25, which would trigger the doji pattern. If futures, then aggressive stops could be placed above the doji high of 5440.00. Conservative stops could be placed above my upper resistance zone @ 5535.75. Some bearish options plays could make sense as well. If the doji high holds, then I see a potential downside move to the 5105 to 5000 range. If the doji pattern doesn't get triggered and we move higher, then I will wait and look for another sell signal.


Thursday, March 16, 2017
Nasdaq (update)
We formed a doji candlestick today. It could just be the market taking a breather, but it's placement on the chart has me thinking possible top. First, it's taking place in my resistance zone @ the 361/461 Fib combo. Second, the RSI shows bullish divergence. Third, the doji formed @ the monthly R1 pivot. And finally, we already have a bearish MACD crossover. I would definitely start thinking of putting on some small bearish positions. At the very least, if long, I would be thinking of taking profits up here.


Orange Juice
Orange Juice (JOK7) is poised for a nice upside move. It confirmed a double bottom on March 7th with a close above 174.90. My minimum target is @ 187.50 with the overall target @ 191.70. We had bullish divergence on the RSI to support this pattern. In addition, there was a measured move (MM) breakout that had a shallow retracement with 4:1 right-handed skewing. This is very bullish and gives upside targets of 190.55 (conservative) to 209.04 (aggressive). My analysis calls for a move up to at least the 187.50 to 191.70 area (blue box on chart below).


Wednesday, March 15, 2017
Nasdaq (update)
Prices ended up higher today after the FOMC decision. It looks like we are headed into the very top of my overall resistance zone. The sweet spot to look for a sell signal will be between 5444.25 and 5535.50. If prices trade above that zone, then this MM Fade pattern fails. I would need to see more signals supporting a bearish trade, but so far there's a monthly R2 pivot towards the top @ 5512.42. Also, locally we have 2 MM's creating Fib combos in the zone. Let's see if we get a bearish candle pattern to form.


Cocoa (update)
The monthly R1 and the 50 DMA did prove to be resistance today as expected. The good news is that it did not reject strongly from it. Let's see if it can overcome them tomorrow and make a push higher towards that falling window pattern. Also, we didn't close above 2060, so our double bottom pattern failed to confirm today. Maybe it will tomorrow. Stops should be placed ~ 1940.
The minimum target is @ 2190 (78%) and the overall target is @ 2234
(100%).

Tuesday, March 14, 2017
Facebook (update)
I’d be surprised to see a move above 144
without having a nice correction. Let’s
see how things play out after the FOMC announcement.

Nasdaq (update)
FOMC meeting tomorrow could create some
volatility. It could push us into the
upper end of my resistance zone between 5445 and 5540. I’d prefer to look for a short trade within
it. However, you could consider entering
a small bearish play with a break below 5344.50. That’s the 361 Fib combo and is shown on the
chart below with a small line.

Cocoa (update)
We saw continued bullish momentum today and
reached the overall sym triangle target of 2047. Cocoa also just reached the 50 DMA, but
closed below it. That’s not surprising,
as it has not closed above it since Aug 26th, 2016. The monthly R1 is right in the same spot, so
this level could prove tough to overcome.
If it does, it could be a significant turning point. Finally, if we get a close above 2060, then
we have a confirmed double bottom pattern.
Stops should be placed ~ 1940.
The minimum target is @ 2190 (78%) and the overall target is @ 2234
(100%).

Monday, March 13, 2017
Nasdaq (update)
We look to be headed into the upper part of my
overall resistance zone. I really like a
possible bearish trade someplace between 5423 and 5540. If a top does form in that zone, then I
expect a move down to at least a 50% retracement.

Cocoa (update)
Today was a good day for my bullish case. We had a MM breakout, although with a deep
retracement. I’d prefer neutral or
better. We also had confirmation of a
symmetrical triangle pattern. Entry
price was @ 1948 with stops @ 1881.
Minimum target was @ 2022, which we reached today. Complete target is @ 2047. We also had the engulfing candle pattern
entry on March 3rd. Finally,
prices also closed above the 20 DMA and monthly pivot point for the 1st
time since Feb 16th. The 10
DMA served as downside support. The next
upside obstacles are the 50 DMA, monthly pivot, a 261 Fib projection, and a
falling window.

Saturday, March 11, 2017
Facebook (update)
Overall, the chart still looks very healthy,
but today we did form a star candlestick pattern with a small body. It wasn’t small enough to form a doji, but
still indicates a possible sign of exhaustion.

Nasdaq (update)
First off, I’ve moved my analysis to the June
contract. Second, we are still trading
within my overall Fib resistance zone.
So, any signs of a top can trigger a bearish position. Third, there’s a pocket of solid overhead
resistance towards the top of my overall zone @ 5423 to 5540. This could present the ideal short trade.

Cocoa (update)
Dollar weakness on Friday may have helped prop
up Cocoa prices. We got a pretty nice
rally closing a tick above the 10 DMA. There’s
also a potential symmetrical triangle pattern forming, but it could either be a
continuous pattern or a reversal pattern.
If we get a breakout to the upside, then it will be a reversal
pattern. This could be the trigger to
jumpstart a bigger rally, so there will be a chance to add to our bullish position. You would enter @ 1948 with stops @
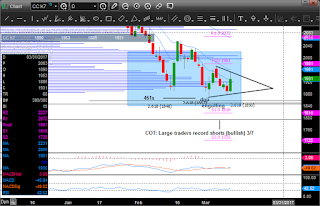
1881. Finally, the latest COT report
shows large traders holding record longs.
That’s a bullish indicator. We
must see some follow through buying early next week to gain upside momentum.

Thursday, March 9, 2017
Facebook (update)
The shooting star pattern is no longer valid,
but no trade was initiated either. My
trading pattern indicator fell back to 4 from 6. I will continue to look for sell trigger.


Nasdaq (update)
The 10 DMA has now held as support for 4
consecutive days. But, we’ve also been
trading sideways all week. I expect
Friday to change that with the unemployment report. I will also be moving to the June contract
starting tomorrow and would consider shorting ~ 5255.00.

Cocoa (update)
Our engulfing buy trade is still intact as
long as prices stay above 1868, but it’s not looking good. I expect to prices to make new lows tomorrow
stopping this trade out. A breach of
1840 voids the overall pattern as well.

Tuesday, March 7, 2017
Facebook (update)
We made new highs today, but found resistance
at the monthly R1 pivot. We also formed
a shooting star candle pattern, which is bearish. My trade pattern ranking moved up to 6 from
4. It’s the first sign of a potential
bearish trade. You could either put on a
small bearish option trade OR trade off the candle pattern. You could enter below today’s low @ 136.98
with stops above today’s high @ 138.38. I
would prefer a bearish trade at higher prices, but it’s definitely now worth a
low risk trade as it stands now.

Nasdaq (update)
Price action found support again today at the
10 DMA, closing above it. We haven’t
closed below it since January 3rd.
I wouldn’t be surprised to see some profit taking ahead of Friday’s
unemployment.

Cocoa (update)
Today we saw sellers pick up where they left off
yesterday and closed near the lows of the day.
The recent low is definitely in jeopardy and I would expect more selling
on the open tomorrow.


Monday, March 6, 2017
Cocoa (update)
We opened gap higher today, but sellers
controlled the day as we closed near the lows.
The 10 DMA served as resistance for the 2nd day in a row. I'd like prices to stay above 1917, which is
the 50% retracement level between today's high and last Thursday's low. This would maintain a healthy correction and
anything lower would become more bearish.
Also, the latest COT report shows large traders holding near record
shorts, which is a bullish indicator.
This is another good sign of a potential bottom forming.

Friday, March 3, 2017
Nasdaq (update)
Price action resumed up today after
yesterday's pause. I think we will test
the monthly R1 @ 5425.

Cocoa (update)
We did get some follow through buying today and had a close above the
doji high. That makes it a high close
doji pattern. So, the past 3 days have
been bullish, which is a good sign. We
also had an opportunity to put on a small bullish position today @ 1941 with
stops @ 1868. The 10 DMA served as
resistance as we failed to close above it.
This will be the next upside obstacle we will need to take out.

Cocoa (bullish position)
Yesterday, a bullish engulfing candlestick pattern formed setting up a potential bullish trade. You could go long @ 1941 with stops @ 1868. Minimum objective @ falling window ~ 2134.00. Risk would be 730.00/contract and potential reward ~ 1930.00


Thursday, March 2, 2017
Facebook (update)
FB made new highs on selling and it’s
officially an active pattern. However,
there’s not enough supporting evidence to place a bearish trade yet. I’d like to see it trade higher first.

Cocoa (update)
Cocoa made new lows on buying today and formed
a bullish engulfing candlestick pattern.
This is one day after forming a doji candle. This is also the same level we saw buyers
come in last week. Taken all together,
it’s a bullish sign. But we would want
to see some follow-through buying tomorrow.
We did manage to create some bullish divergence on the RSI with
yesterday’s new lows, which will be a great sign if it turns into a double
bottom pattern.

Nasdaq (update)
I’m not sure if today was profit taking or the
start of something bigger. But, today’s close
is still above the 10 DMA, so that would be the first downside test. There’s still not enough supporting data to
establish a bearish position and ideally I’d like to see it trade a bit higher
and form a bearish candle pattern.

Wednesday, March 1, 2017
Facebook (update)
FB followed the overall market and made new
highs today closing near its top. We are
just 3 ticks from my resistance zone so I’m officially making this pattern
active. I will now look for reversal
signs.
Nasdaq (update)
Very bullish action today as prices pushed
into the lower end of my resistance zone.
There’s still no supporting data confirming a reversal and I expect it
to test the upper boundaries of the blue box below. But, there’s lot of upside resistance up
through 5525.
Cocoa (update)
The Feb 15 low @ 1889 was taken out today and
in the process it voided out the high close doji pattern. However, we made a new doji pattern today signaling
some indecision. The pattern becomes
void below 1840, so tomorrow will be key.
Are we forming a double bottom pattern? Or was today a pause before
making further lows?
Subscribe to:
Posts (Atom)

