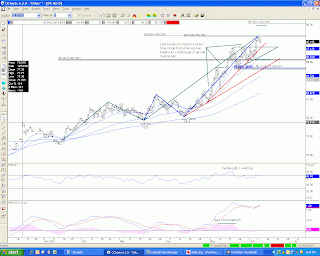
Back on May 22nd I gave a couple possible support zones. The first zone (85.25-85.40) held and we have been moving higher since. We had an ascending triangle breakout on June 4th, but the market ran into some fib resistance in the 88.7508-88.8275 area (actual high was 88.80). You have some conflicting signals at these levels:
Bullish: still maintaining two upward trendlines (shown in red); still above all moving averages (10,20,50,100); still making higher highs, higher lows.
Bearish: hit some stiff fib resistance ~ 88.80 (461/361 extensions); RSI price divergence signals warning; MACD showing loss of upside momentum; ran into pivot resistance yesterday (DR1,MR1,WR1).
skip to main |
skip to sidebar

Short Term Technical Analysis of Futures Markets
Thomas C. Bills

Background:
I'm currently a middle office analyst for a proprietary trading firm. I have a BS in finance from the University of Illinois (Champaign-Urbana). I have 20+ years of experience in this industry ranging from working on the trading floors of the CME and CBOE, working in back-office operations, managing a clearing department, trading equities for a prop firm, and trading futures for my own account. I'm also a contributing author on Inside Futures.
You can follow me on Twitter: @tbills_trading.
Trading Signals:
I currently follow 30 different futures markets in the following sectors: grains, softs, meats, metals, energy, indexes, interest rates, and currencies. All of my market analysis is technical based and looks for key areas of support and resistance that generally provide trades with reward to risk ratios of 2:1 or better and also identifies areas for profit-taking.
You can get all of my trade signals from my TechSpeak trading system by following me on Collective2 for 50.00 per month.
disclaimer:
There is a high risk of financial loss in stocks, futures, and options trading. Past performance is not necessarily indicative of future results. Nothing on this blog/newsletter is intended to be a trading recommendation for you to buy or sell stocks, futures, or options. Readers are solely responsible for how they use this information.

No comments:
Post a Comment