
Thursday, May 28, 2015
British Pound (update)
We are seeing continued weakness today in the British Pound. We are now trading near the lows of the buy zone and we'd like to see this area serve as support. If we traded this pattern aggressively, then we'd currently be long. If we wanted to be more conservative, then we'd still be waiting for entry above yesterday's high OR waiting for a candle pattern to form in this buy zone area.


Cocoa (update)
Yesterday I mentioned to be on the lookout for more clues that could signal a top. We got two more based on yesterday's close. First, we got a bearish crossover on the MACD. This is the first bearish crossover since 3/6/15, which was the the start of the last sell off. Second, we formed a bearish engulfing candle. This pattern is even more significant because of it's location. It formed in a fib cluster of resistance, near the 78.60 retracement zone, and near MR2. I'd like to see some downside follow through today and will add to my short position below 3112 with tight stop @ 3182. If the recent high of 3181 is taken out, then the engulfing pattern is void. Also, we are still above the 10, 20, 50, and 100 DMA. So these are all downside obstacles that will serve as support. First up is the 10 DMA ~ 3114. Then we have the 20 DMA ~ 3058 along with MR1, which now becomes potential support, @ 3044. Following that will be the 3/3/15 high @ 3023. Let's watch and see if this market now attempts to go lower and test these support levels OR if we make new highs and test the next cluster of resistance. Either way I believe we are in for a correction in Cocoa.


Wednesday, May 27, 2015
Cocoa

There's a potential selling opportunity developing in the July 05 Cocoa futures. The recent uptrend off the 3/30/15 low has produced three measured move patterns. The dominant pattern is the double bottom and has 3:6 left handed skewing. The 1st supporting pattern has medium deep retracement with 3:4 left handed skewing. The 2nd supporting pattern has neutral retracement with 0:6 left handed skewing. The fact that none of the 3 patterns have retracements that are shallow plus all have left handed skewing points to a potentially good shorting opportunity. Each pattern also projects 3 key Fib levels for possible targets. Individually, they don't carry as much weight, but together they can provide clusters of strong upside resistance. The key is to look for other clues to help pick the right cluster.
Some other clues I see:
-we are trading around the 78.60 retracement between the Sept 2014 high and the Feb 2015 low. This retracement level is often important by itself and very important when combined with other factors
-we are overbought on the RSI and approaching a bearish crossover on the MACD
-we are trading around the Monthly R2 level @ 3140, which can signal the move being overextended
Resistance Cluster Averages:
#1: ~ 3127
#2: ~ 3196
#3: ~ 3263
We are currently in the first cluster average range and should establish a small short position. Stops would intitially be placed above the 3301 high from last September. The next cluster average is 3196. Look to add to short position at that level. We can also look for more clues to add to our short position as this pattern continues to unfold. Some things to look for include: candlestick patterns and western patterns.
One last thing to note is that the most recent surge off the 5/1/15 low has been very bullish. Because we've entered the current resistance zone this way, it could take a few days to a week before we sell off. It should need time to shake off the bullish energy it has the past 2 weeks. The market should give us some indication before it looks to roll over.
British Pound

There's a potential buying opportunity developing in the Sept 05 British Pound futures market. The recent uptrend off the 4/10/15 low has a measured move pattern with a shallow retracement, which is bullish. However, it has 2:4 left handed skewing (2 bars down, 4 bars up), which means it has weak upward momentum. That's why we are seeing a pullback off the recent highs of 5/14/15. This pullback has formed it's own measured move pattern with a medium deep retracement and 2:2 neutral skewing (2 up, 2 down). This is exactly the type of retracement we want when considering entering on a pullback. The buy zone is roughly between 1.5234 and 1.5338 with stops below 1.5074. The most conservative target is around 1.5953 with a few more aggressive targets higher.
Some entry ideas with stops @ 1.5073 and intitial target of 1.5953:
#1: enter long position within this buy zone of 1.5234 to 1.5338...example: avg of zone @ 1.5286
#2: enter long position above the high of the most recent trading day within this buy zone....becomes open order tomorrow
#3: wait for candlestick pattern to form within this buy zone....none yet
Sunday, October 13, 2013
Sugar
Sugar was able to finish out the week with a strong close @ 18.87, which was above the 50 WMA. This was the first close above the moving average in over a year. The high of the day was 18.95, one tick above resistance zone #5, and closed inside the 18.71 to 18.94 zone. I wouldn't be surprised to see a pullback from these levels and the recent upside move is a bit overbought. Let's see if resistance zone #5 causes some weakness this week or if the recent bullish action is to much to contain it.
Finally, recapping my original Sugar post from early September:
* we have met the first 2 of 3 short term objectives with only the 19.38 level remaining
* we are still looking for a long term objective of around 20.25-20.75
I will follow up at the end of this week to show how Sugar at it's current resistance zone and then take some time off from this market. I will give more updates if it approaches it's long term target area.

Finally, recapping my original Sugar post from early September:
* we have met the first 2 of 3 short term objectives with only the 19.38 level remaining
* we are still looking for a long term objective of around 20.25-20.75
I will follow up at the end of this week to show how Sugar at it's current resistance zone and then take some time off from this market. I will give more updates if it approaches it's long term target area.

Thursday, October 10, 2013
Sugar
Today's high of 18.76 hit the lower end of resistance area #5: 18.71-18.94. It was a bullish day as it had a nice long body with a strong close near its high. I do expect prices to find resistance in this zone. It could be temporary though as we have seen great strength coming into this level the last two weeks. However, let's remember we haven't had a weekly close above its 50 WMA since July 2012. Let's see where we close out the week tomorrow. The 50 week is around 18.74.
Thursday, October 3, 2013
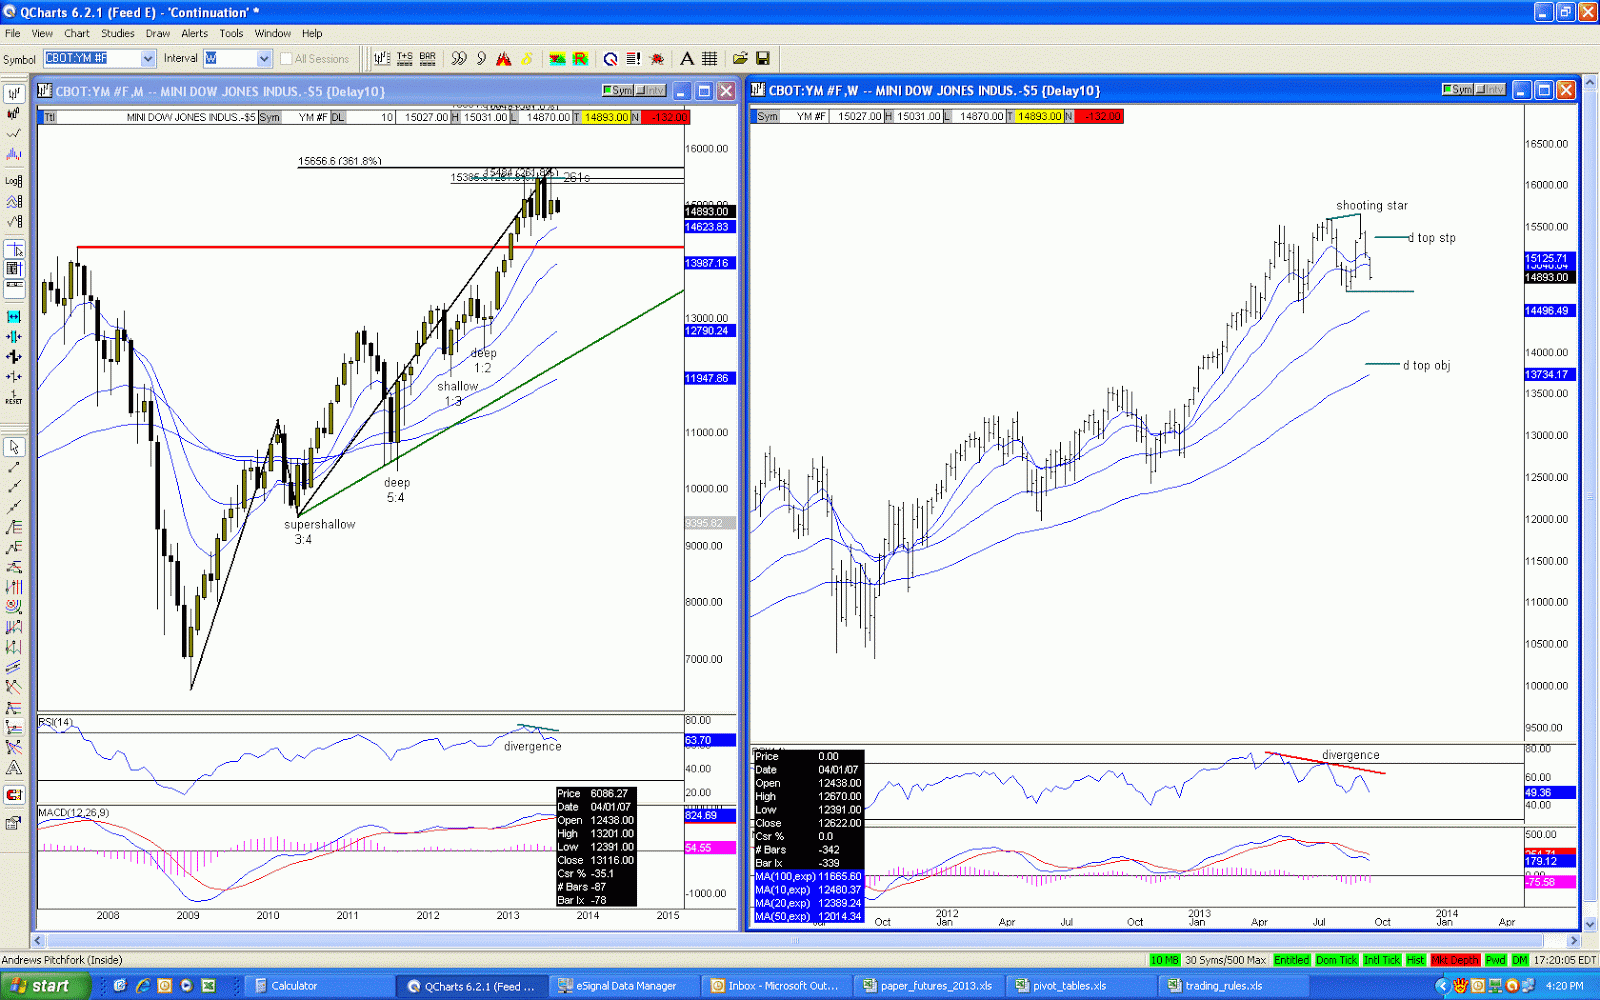
DJIA futures continuation chart
There is a potential double top pattern forming on the weekly DJIA futures continuation chart shown below. We need a weekly close below 14740 for this pattern to be confirmed. The pattern objective would be around 13858 with a potential stop around 15375.
First, some supporting background on the monthly chart. The most recent high of 15658 was right in the middle of a fib cluster based on 3 ABCD patterns. The dominant pattern dates back to a late 2010 activation. So we are seeing the current high being formed in an area of potential significant resistance. There is also some bearish divergence seen on the monthly RSI.
Second, some supporting background on the weekly chart. We've seen the market recently make its third new high since May, but barely moving much higher than the previous highs. As a result, we also see bearish divergence on the weekly RSI. This shows a slowing of upside momentum. Finally, the most recent high of 15658 was made on a weekly shooting star pattern. We have since seen selling pressure the past week and a half.
Let's see if this double top pattern gets confirmation in the next week or two. If so, then the objective of 13858 should be reached.

First, some supporting background on the monthly chart. The most recent high of 15658 was right in the middle of a fib cluster based on 3 ABCD patterns. The dominant pattern dates back to a late 2010 activation. So we are seeing the current high being formed in an area of potential significant resistance. There is also some bearish divergence seen on the monthly RSI.
Second, some supporting background on the weekly chart. We've seen the market recently make its third new high since May, but barely moving much higher than the previous highs. As a result, we also see bearish divergence on the weekly RSI. This shows a slowing of upside momentum. Finally, the most recent high of 15658 was made on a weekly shooting star pattern. We have since seen selling pressure the past week and a half.
Let's see if this double top pattern gets confirmation in the next week or two. If so, then the objective of 13858 should be reached.
Subscribe to:
Posts (Atom)

