Tuesday, August 11, 2015

CRB Total Return Index

Product Summary:
The CRB Total Return Index is comprised of 19 commodities (Aluminum, Cocoa, Coffee, Copper, Corn, Cotton, Crude Oil, Gold, Heating Oil, Lean Hogs, Live Cattle, Natural Gas, Nickel, Orange Juice, Silver, Soybeans, Sugar, Unleaded Gas, and Wheat).  I personally monitor 15 of these 19 markets on a daily basis. 

Market Summary:
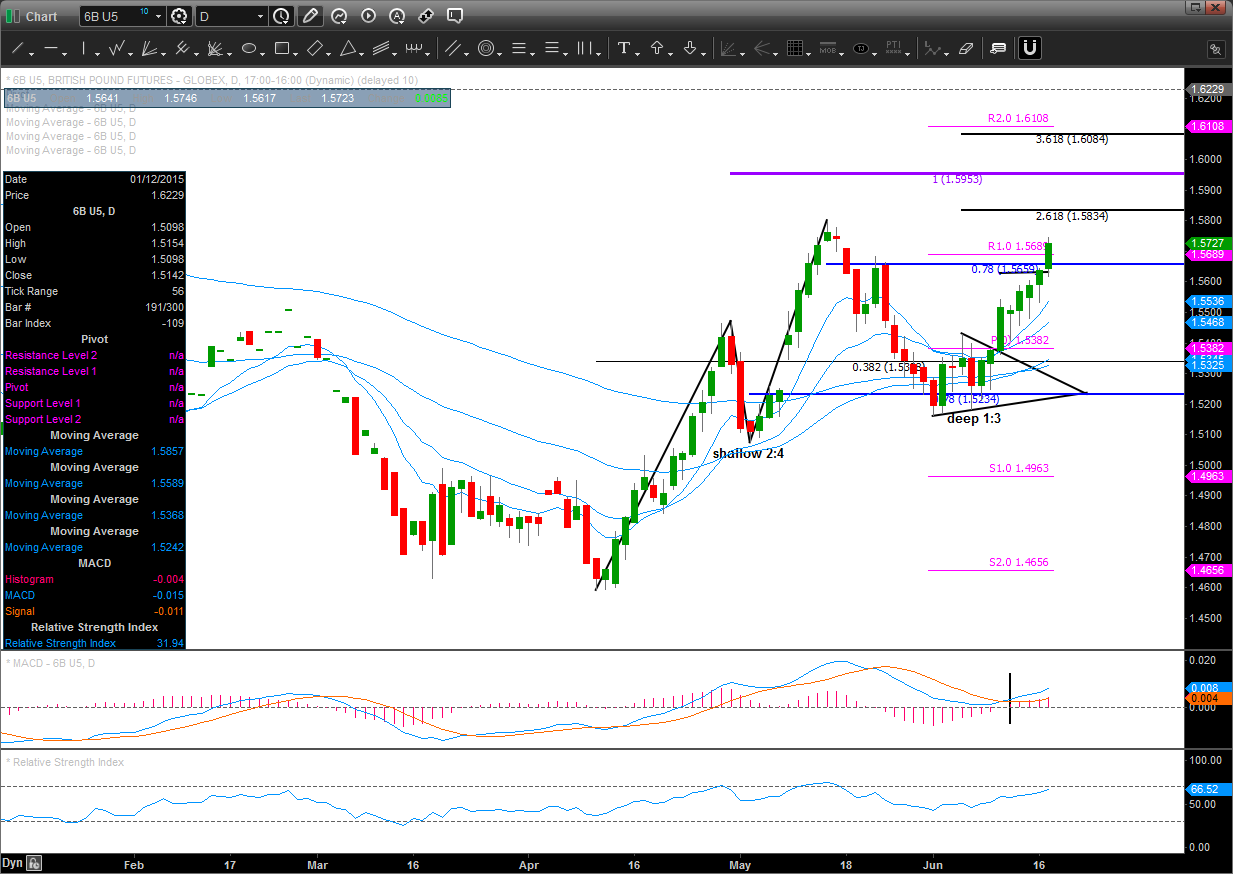
The CRB has been in a downtrend since April of 2009, but I'm starting to see strong signs of a potential bounce higher. The most recent leg down starting from the 5/6/2015 high has 3 measured moves.  MM #1 has a medium deep retracement (bearish) with a 9:17 left-handed skew (bearish).  MM #2 has a deep retracement (bearish) with a 13:3 right-handed skew (bullish).  MM #3 has a shallow retracement (bullish) with a 5:4 right-handed skew (bullish).  Here's what these 3 measured moves together are telling us:
* Bearish retracements for MM #1 and MM #2 indicate a counter trend rally that should retrace a minimum of 50%.
* Shallow retracement for MM #3 indicates the potential bottom can extend to lower Fib projections.
* Right-handed skewing, which is bullish, on 2 of the 3 MM's indicates the potential bottom can extend to lower Fib projections.
* Shrinking time ranges of the three MM's (26 to 16 to 9) indicates the downtrend is slowing down and a bottom could be near.

Potential Bottom:
Now that we know a potential bounce is in play, let's look at some signals of where this turn could happen.  First, we find potential bottoms using Fib projections of the 3 measured moves.  I like to use the following averages of MM #1 and MM #2: 261/261, 361/261, 361/361, 461/361, and 461/461.  The shallow retracement of MM #3 along with the bullish skewing of MM #2 and MM #3 tells us that the potential bottom could extend lower than the 261/261 area.  As we reach each of these averages we look for other clues to help guide us.  Prices reached the 361/361 level on 8/7/2015 and immediately formed a morning star candlestick pattern, which is bullish.  We also see bullish divergence on the RSI and a bullish crossover on the MACD.  Finally, the 8/7/2015 low was formed in the same area as the February 2009 low.  This former low was an area that buyers came in and pushed prices signficantly higher.  It stands to reason this could be a good place for a counter-trend rally.

Potential Support Zones:
361/361: ~ 198.30
361/461: ~ 195.40
S1: 195.02
461/461: ~190.07
S2: 186.93

Potential Upside Rally:
It's very possible that the 8/7/2015 low will provide the bounce, but we could see a little further downside before moving higher.  Either way, I believe a counter-trend rally will happen soon.  Using the potential low of 198.35, I see strong possibility of a rally to the 50% retracement or better.  The 50% retracement is currently @ 216.24.

Potential Upside Targets & Obstacles:
10 DMA: ~ 202.30
MM #2 retracement value: ~ 204.75
MM #3 retracement value: ~ 205.16
20 DMA: ~ 205.93
MM #1 retracement value: ~ 208.79
Monthly Pivot: 210.90
38% retracement: 212.01 [conservative target]
50 DMA: ~ 213.18
50% retracement: 216.24 [conservative target]
100 DMA: ~ 219.42
61% retracement: 220.46 [aggressive target]
78% retracement: 226.26 [extreme target]

Summary:
The recent 3 month downward move has started to present numerous signals of a potential counter-trend rally.  I believe if the short-term low hasn't already been put in @ 198.35, then it will happen soon before reaching 189.00.  Finally, once a low is established, I anticipate at least a 50% retracement rally.


Thursday, June 18, 2015

British Pound (update)

We saw continued strength yesterday after the FOMC meeting with prices pushing through the 5/14 high and more buyers so far today.  We reached two more upside targets and closed out of the aggressive position @ 1.5800.  Also, we now have a new dominant structure as the time range has exceeded the original one by 2x.  I've redrawn to demonstrate.  It has a neutral retracement and neutral (11:12) skewing.  There is a smaller pattern within this bigger one with a very deep retracement and left handed (1:3) skewing. 

Here's what's remaining from my original analysis:
Current Positions:
**moderatively aggressive: @ 1.5356 with trailing stp @ 1.5615; tgt @ 1.5953

Closed Positions:
**conserative: @ 1.5374 with stp @ 1.5193; closed @ 1.5625 for Profit
**aggressive: @ 1.5286 with stp @ 1.5073; closed @ 1.5800 for Profit

Potential Upside Targets:
1) 78.60% Level: 1.5659 (tgt met)
2) 5/14 High: 1.5800 (tgt met)
3) 2.618 Level: 1.5834 (tgt met)
4) 1.00 Level: 1.5953


Wednesday, June 17, 2015

British Pound (update)

We saw prices reach the symmetrical triangle objective of 1.5625 yesterday and stop just short of the 78.60 retracement zone @ 1.5659.  Buyers continued the momentum this morning and so far have pushed prices past the MR1 @ 1.5689 and are knocking on the door to reach the 5/14 High of 1.5800.  We have sustained a nice rally the past 8 days, but we have the FOMC decision later today.  Let's see how this market reacts this afternoon.

Current Positions:
**aggressive: @ 1.5286 with stp @ 1.5073
**moderatively aggressive: @ 1.5356 with stp @ 1.5073

Closed Positions:
**conserative: @ 1.5374 with stp @ 1.5193; closed @ 1.5625 for Profit

Potential Upside Targets:
1) 78.60% Level: 1.5659: tgt met
2) 5/14 High: 1.5800
3) 2.618 Level: 1.5834
4) 1.00 Level: 1.5953

Monday, June 15, 2015

British Pound (update)

Let's recap price action for the past week in the Pound.  It was very bullish as we saw buyers come in every day last week pushing prices above the Monthly Pivot and the 10, 20, 50, and 100 DMA's.  We also got a bullish MACD crossover signal on Thursday.  Finally, we saw the market break out of a symmetrical triangle pattern on Wednesday.  The objective of this pattern is ~ 1.5625, just below the 78.60% retracement level @ 1.5659.  This small range will be the next area of upside resistance followed by MR1 @ 1.5689, and the 5/14 high @ 1.5800.

Current Positions:
**aggressive: @ 1.5286 with stp @ 1.5073
**moderatively aggressive: @ 1.5356 with stp @ 1.5073
**conserative: @ 1.5374 with stp @ 1.5193

Potential Upside Targets:
1) 78.60% Level:  1.5659
2) 5/14 High:         1.5800
3) 2.618 Level:      1.5834
4) 1.00 Level:        1.5953

Cocoa (update)

They key quote from last Monday's post was:
" This downside pattern is still intact, but is voided if it takes out the 5/21 high @ 3181 after 6/11. The 20 DMA is currently the next level of support needed to be taken out in order to see more downside action."
Well we saw the 20 DMA hold all week and bounced on Friday closing at it's highest level since 5/26.  This set up follow through buying on today's open taking out the 5/21 high @ 3181 voiding this pattern.  We never got the deeper retracement I was looking for and the 20 DMA ultimately was to strong a support level to break at this time.

Monday, June 8, 2015

Cocoa (update)

It's been a few days since my last post, so let's catch up in this market.  We found support last Monday and Tuesday at the 20 DMA and got a nice bounce Tuesday off this level closing back above the 10 DMA.  We stayed above the 10 DMA on Wednesday and Thursday, but got no follow through buying as a piercing line candle formed on Thursday.  We closed back below the 10 DMA on Friday, but found support yet again at the 20 DMA.  This market is currently grinding sideways before it makes its next move higher or lower.  This downside pattern is still intact, but is voided if it takes out the 5/21 high @ 3181 after 6/11.  The 20 DMA is currently the next level of support needed to be taken out in order to see more downside action.


British Pound (update)

It's been a a few days since my last post, so let's catch up on this market.  We've been chopping sideways the past 5 days and are currently below all 4 moving averages that I follow so this pattern is currently looking weak.  However, this pattern is still intact as we have not taken out the 5/4/15 low @ 1.5109.  Also, we would've gotten long on 6/3 @ 1.5356 (tick above previous day's highs).  So it's possible we'd currently be long from 2 different entries: aggressive @ 1.5286 and moderatively aggressive @ 1.5356 with stops placed @ 1.5073.  Next point of entry would be after a candlestick pattern forms.

Monday, June 1, 2015

British Pound (update)

Thursday and Friday price action saw continued weakness, but the rising window still held as support.  You need a close below 1.5254 to nullify it.  The 100 DMA held as support on Thursday, but broke on Friday closing below.  The 50 DMA held as support on both days, but is the last of the 4 moving averages still holding as support.  We are currently trading below it early Monday morning.  This pattern is not looking good as of right now, but the key level to hold is 1.5074.  Once we break below that level, then the pattern is void.  However, we'd really like to see the currentl area hold as support and create a reversal to be confident in getting long.  If we were aggressive, we'd be long already a small position.  A more conservative entry is above Friday's high.  Finally, we could wait for a reversal bar or candlestick pattern to form before entering.

Cocoa (Update)

Thursday price action initiated a short position @ 3112 based on the engulfing pattern from Wednesday.  The 10 DMA held as support both Wednesday and Thursday, but finally broke on Friday with a close below.  Next areas of potential support are the 20 DMA ~ 3061, the new June Pivot @ 3042, and the 3/3 high @ 3023.

Thursday, May 28, 2015

British Pound (update)

We are seeing continued weakness today in the British Pound.  We are now trading near the lows of the buy zone and we'd like to see this area serve as support.  If we traded this pattern aggressively, then we'd currently be long.  If we wanted to be more conservative, then we'd still be waiting for entry above yesterday's high OR waiting for a candle pattern to form in this buy zone area.


Cocoa (update)

Yesterday I mentioned to be on the lookout for more clues that could signal a top.  We got two more based on yesterday's close.  First, we got a bearish crossover on the MACD.  This is the first bearish crossover since 3/6/15, which was the the start of the last sell off.  Second, we formed a bearish engulfing candle.  This pattern is even more significant because of it's location.  It formed in a fib cluster of resistance, near the 78.60 retracement zone, and near MR2.  I'd like to see some downside follow through today and will add to my short position below 3112 with tight stop @ 3182.  If the recent high of 3181 is taken out, then the engulfing pattern is void.  Also, we are still above the 10, 20, 50, and 100 DMA.  So these are all downside obstacles that will serve as support.  First up is the 10 DMA ~ 3114.  Then we have the 20 DMA ~ 3058 along with MR1, which now becomes potential support, @ 3044.  Following that will be the 3/3/15 high @ 3023.  Let's watch and see if this market now attempts to go lower and test these support levels OR if we make new highs and test the next cluster of resistance.  Either way I believe we are in for a correction in Cocoa.

Wednesday, May 27, 2015

Cocoa


There's a potential selling opportunity developing in the July 05 Cocoa futures.  The recent uptrend off the 3/30/15 low has produced three measured move patterns.  The dominant pattern is the double bottom and has 3:6 left handed skewing.  The 1st supporting pattern has medium deep retracement with 3:4 left handed skewing.  The 2nd supporting pattern has neutral retracement with 0:6 left handed skewing.   The fact that none of the 3 patterns have retracements that are shallow plus all have left handed skewing points to a potentially good shorting opportunity.  Each pattern also projects 3 key Fib levels for possible targets.  Individually, they don't carry as much weight, but together they can provide clusters of strong upside resistance. The key is to look for other clues to help pick the right cluster. 
 
Some other clues I see:
-we are trading around the 78.60 retracement between the Sept 2014 high and the Feb 2015 low.  This retracement level is often important by itself and very important when combined with other factors
-we are overbought on the RSI and approaching a bearish crossover on the MACD
-we are trading around the Monthly R2 level @ 3140, which can signal the move being overextended
 
Resistance Cluster Averages:
#1: ~ 3127
#2: ~ 3196
#3: ~ 3263
 
We are currently in the first cluster average range and should establish a small short position.  Stops would intitially be placed above the 3301 high from last September.  The next cluster average is 3196.  Look to add to short position at that level.  We can also look for more clues to add to our short position as this pattern continues to unfold.  Some things to look for include: candlestick patterns and western patterns.
 
One last thing to note is that the most recent surge off the 5/1/15 low has been very bullish.  Because we've entered the current resistance zone this way, it could take a few days to a week before we sell off.  It should need time to shake off the bullish energy it has the past 2 weeks.  The market should give us some indication before it looks to roll over.
 

British Pound


There's a potential buying opportunity developing in the Sept 05 British Pound futures market.  The recent uptrend off the 4/10/15 low has a measured move pattern with a shallow retracement, which is bullish.  However, it has 2:4 left handed skewing (2 bars down, 4 bars up), which means it has weak upward momentum.  That's why we are seeing a pullback off the recent highs of 5/14/15.  This pullback has formed it's own measured move pattern with a medium deep retracement and 2:2 neutral skewing (2 up, 2 down).  This is exactly the type of retracement we want when considering entering on a pullback.  The buy zone is roughly between 1.5234 and 1.5338 with stops below 1.5074.  The most conservative target is around 1.5953 with a few more aggressive targets higher. 

Some entry ideas with stops @ 1.5073 and intitial target of 1.5953:
#1: enter long position within this buy zone of 1.5234 to 1.5338...example: avg of zone @ 1.5286
#2: enter long position above the high of the most recent trading day within this buy zone....becomes open order tomorrow
#3: wait for candlestick pattern to form within this buy zone....none yet